Melbourne
Hawthorn East sold insights
Explore recently sold properties, sales activity and pricing trends to better understand local market performance.
Sold results shown for Hawthorn East are intended as street-level evidence, not a general suburb profile. Compare like properties on bedrooms, dwelling type, land, condition and location when you interpret each price. A suburb median alone rarely tells you what a specific home is worth, so treat the individual sales in this list as the starting point.
12-month sales overview
A snapshot of recent sales volume, median prices and key market indicators from the past 12 months.
Total sold
144
Median sold price
$2,444,000
Avg days
28 days
Rental median
$1,125 pw
- Private 26%
- Auction 74%
Most properties are sold via auction, indicating strong competition in the market.
Property sales breakdown
Compare recent sales across property types and bedroom configurations to understand differences in pricing and market activity.
| Bedrooms | 12 mo salesLast 12 months sales | Median price | Avg DOMAvg days on market | Clearance | RentRental median |
|---|---|---|---|---|---|
| AllAll houses | 144 | $2,444,000 | 28 days | 74% | $1,125 pw |
| 1 bed1 bedroom | 0 | — | — | — | $513 pw |
| 2 bed2 bedrooms | 17 | $1,471,000 | 30 days | 55% | $710 pw |
| 3 bed3 bedrooms | 51 | $2,130,000 | 26 days | 71% | $1,100 pw |
| 4 bed4 bedrooms | 46 | $2,750,000 | 29 days | 76% | $1,425 pw |
| 5 bed5 bedrooms | 26 | $4,115,000 | 28 days | 82% | $1,600 pw |
In the current sold sample for Hawthorn East, units make up the majority of transactions (56% of the 228 listings). Houses make up the next largest group in the mix. Two-bedroom layouts were the most common bedroom count among the sales with bedroom data. Private or negotiated sales were the most frequent sale method, at about 64% of recorded results. Disclosed prices in this window ranged from $116,000 to $5,802,500. House results sat above unit outcomes in this sample, with house medians around $1,862,500 compared with $587,450 for units.
Sales by price range
House sales grouped by price band over the past 12 months.
Most sales in the past 12 months sit in the $2m–$3m band (55 sales). Data as at September 2026.
Recent sold properties
Browse recently sold properties to compare sale prices, property features and recent market evidence.
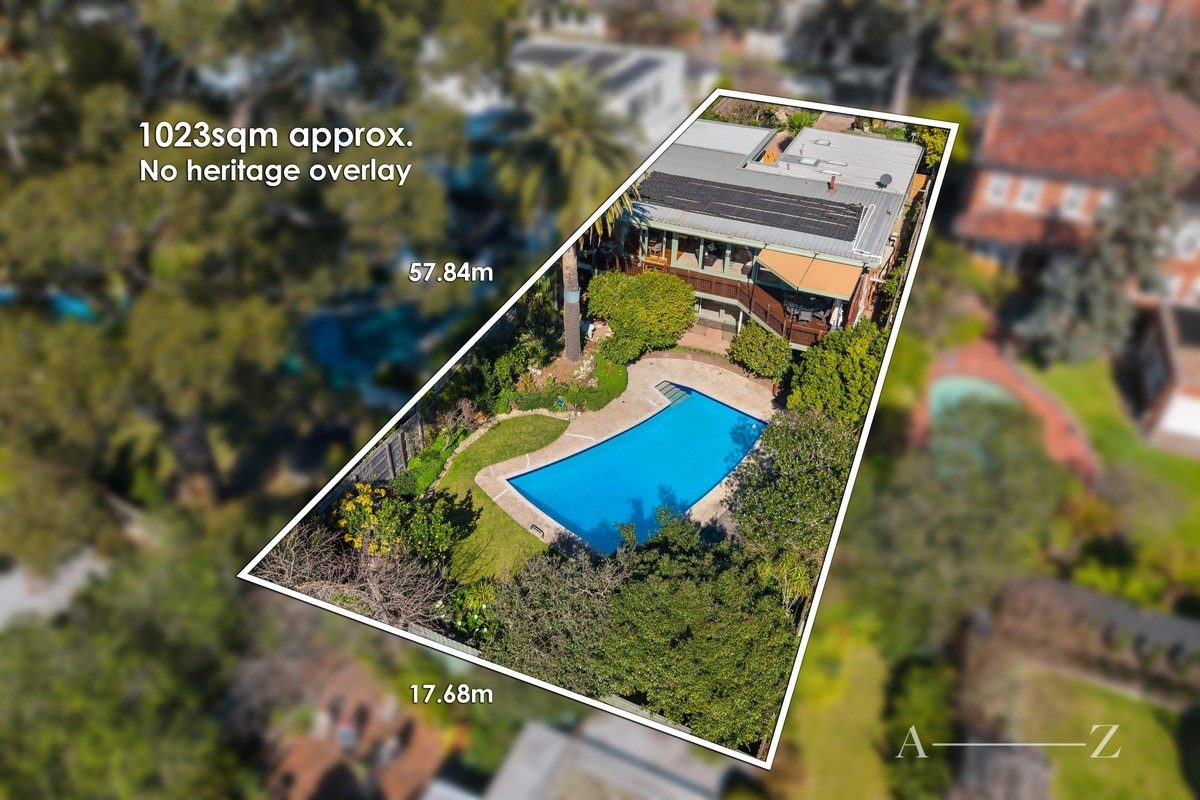
27a Leura Grove
Hawthorn East
434Price withheld
Sold 19 Sept 2026
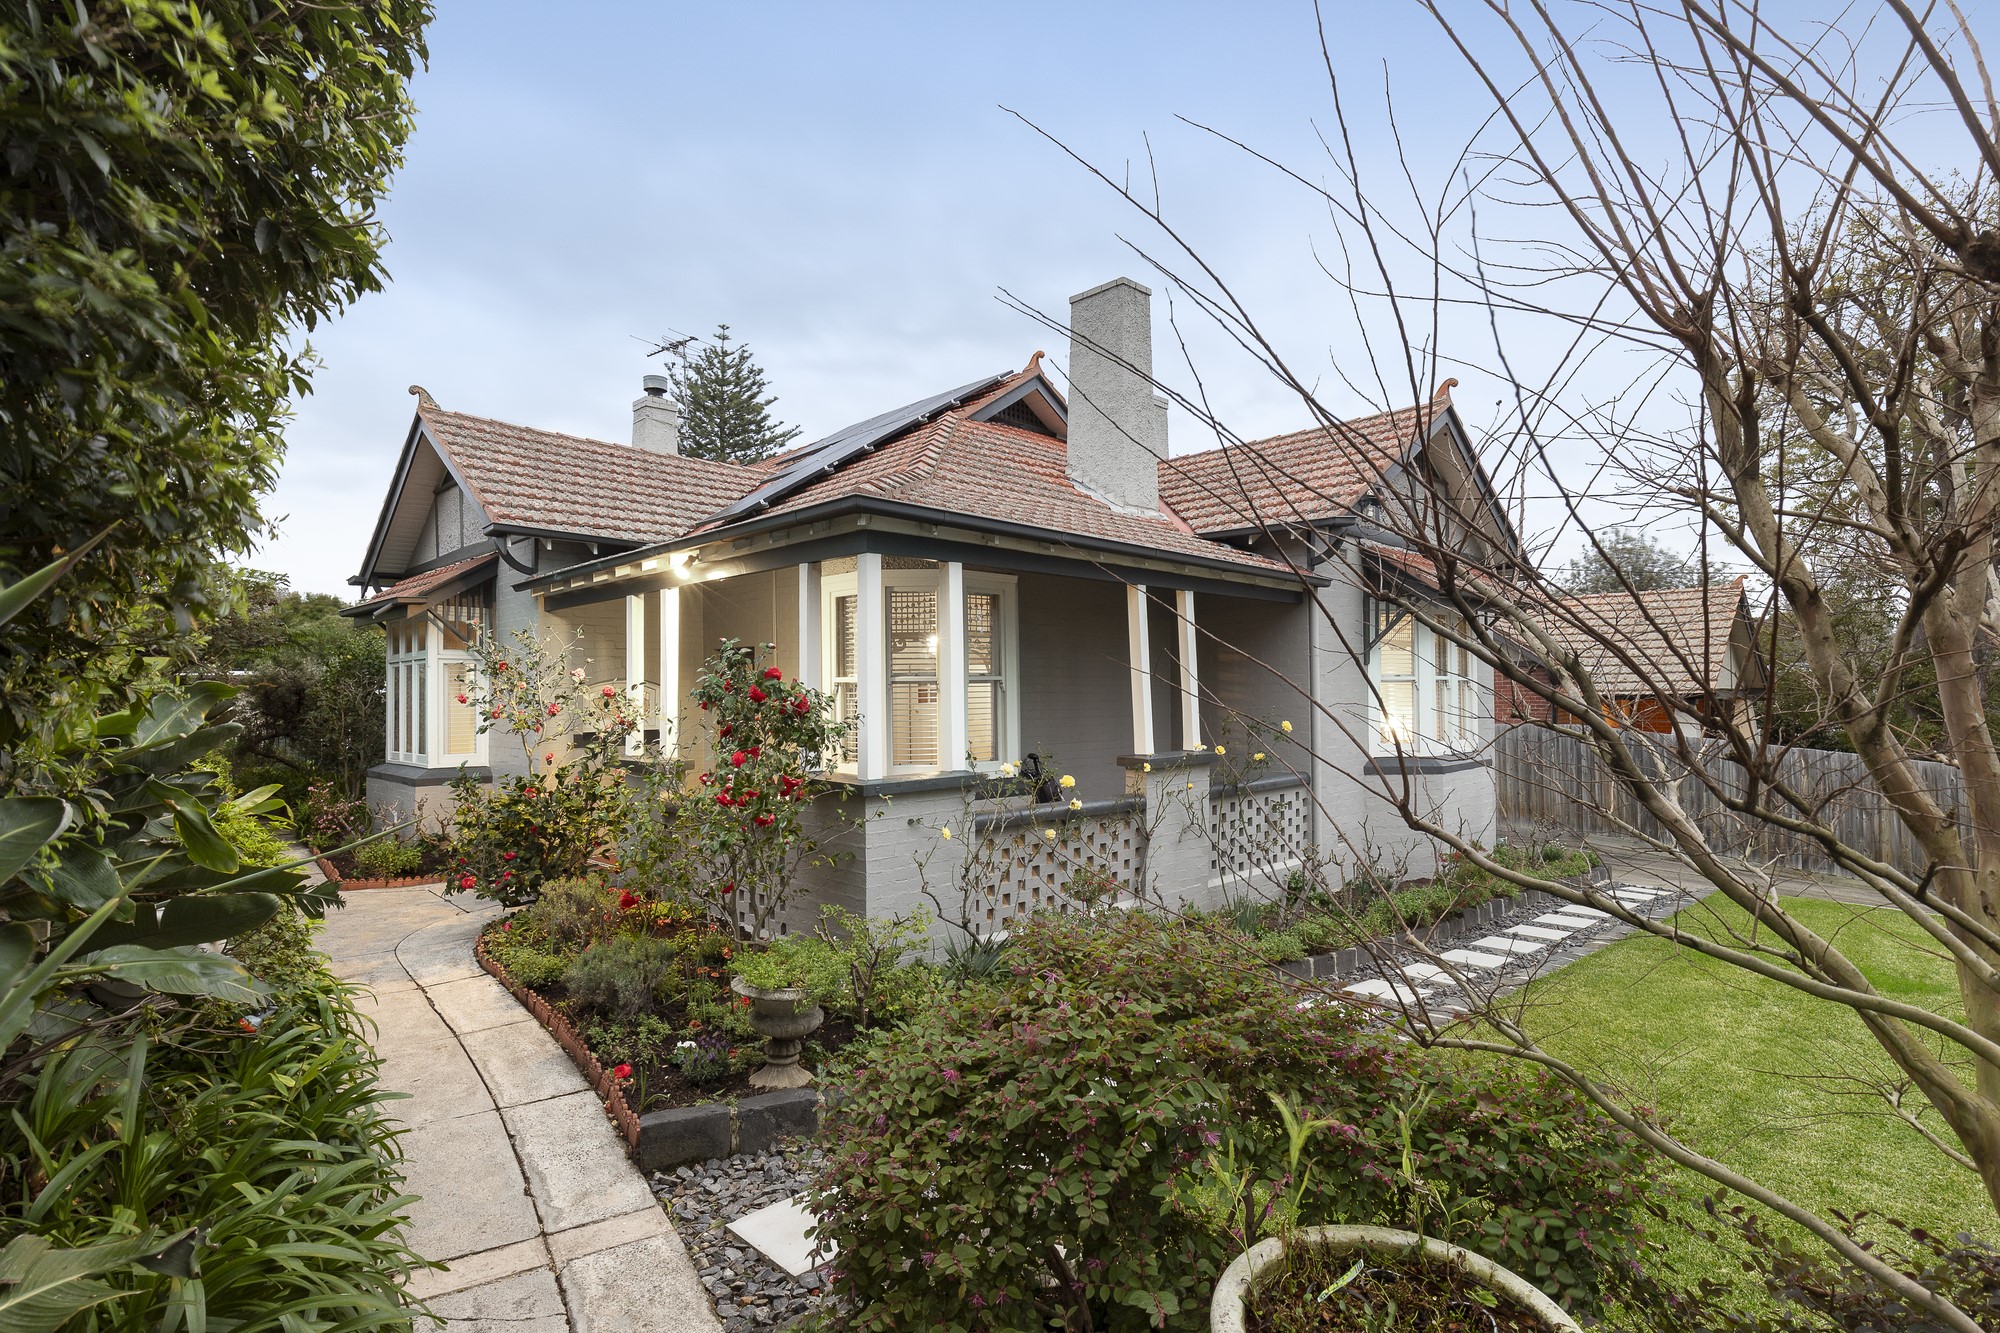
394 Tooronga Road
Hawthorn East
524Price withheld
Sold 19 Sept 2026
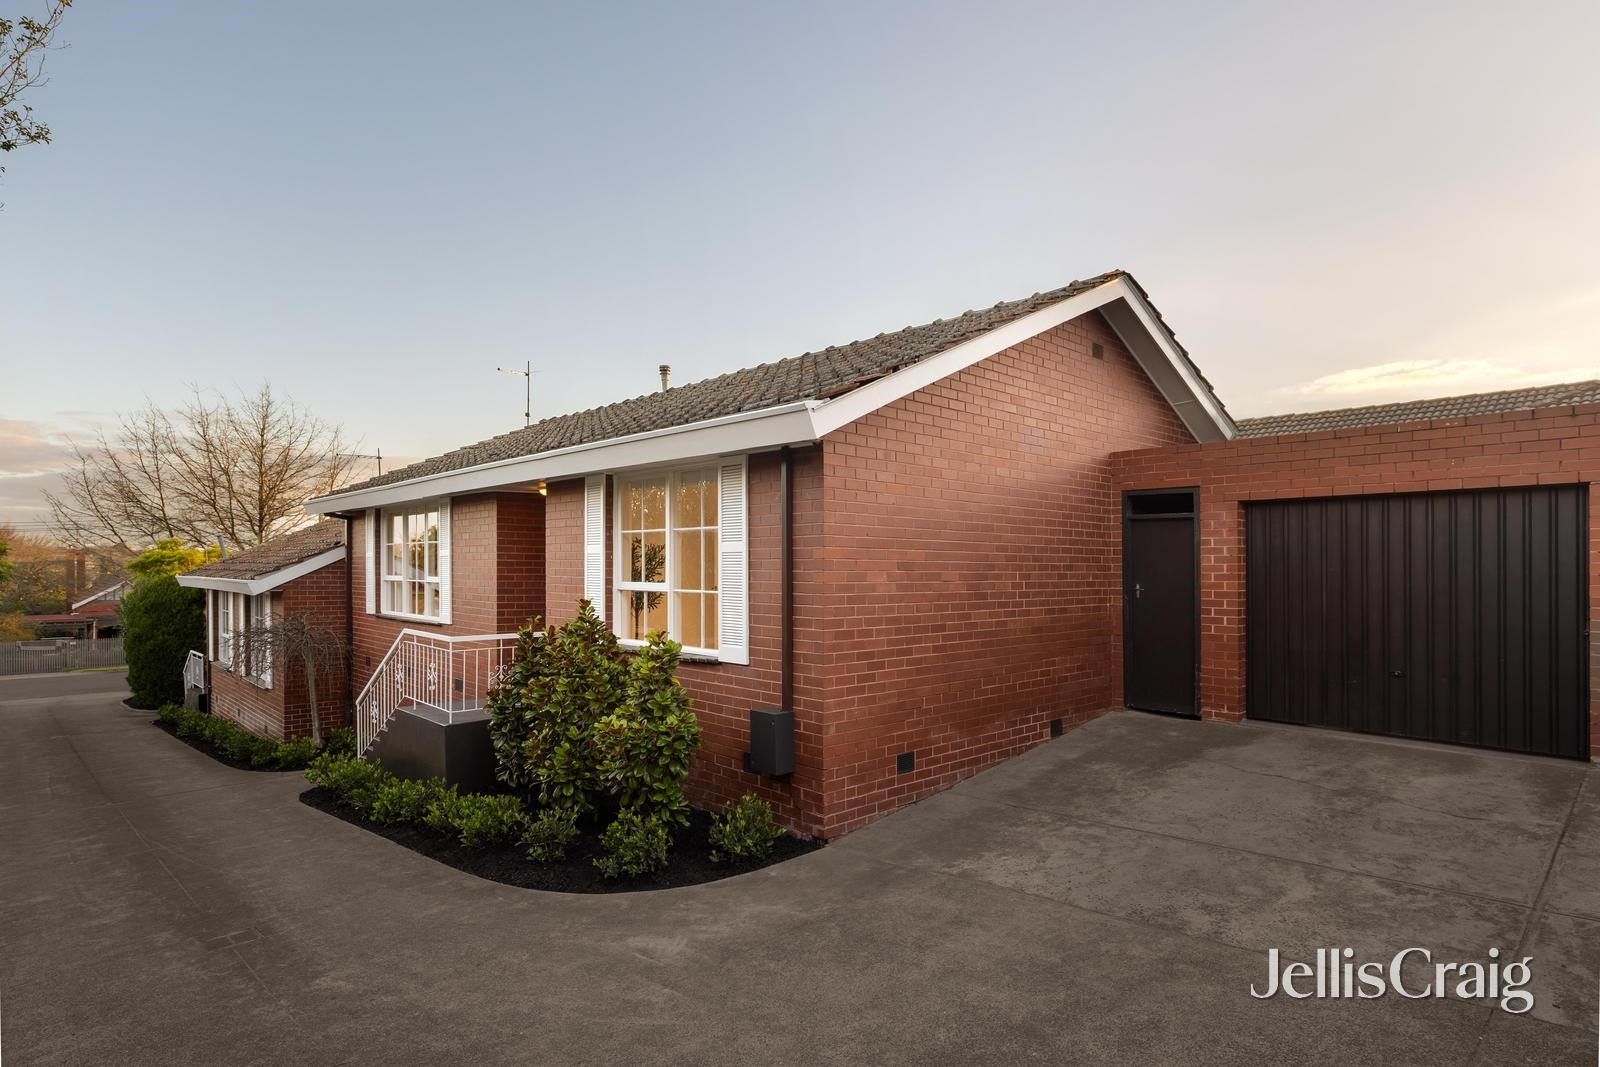
2/41 Clifton Road
Hawthorn East
211$850,000
Sold 19 Sept 2026

24 Mowbray Street
Hawthorn East
532Price withheld
Sold 17 Sept 2026


A more considered view on your property's value