Melbourne
Balwyn North sold insights
Explore recently sold properties, sales activity and pricing trends to better understand local market performance.
Review recent sold properties in Balwyn North to see how each result compares with homes like yours. Value is driven by property type, land, bedrooms, condition, presentation and street position, so similar sales matter more than a broad suburb average. The sold results in this list show what has changed hands locally in the reporting window.
12-month sales overview
A snapshot of recent sales volume, median prices and key market indicators from the past 12 months.
Total sold
326
Median sold price
$2,208,000
Avg days
29 days
Rental median
$913 pw
- Private 34%
- Auction 66%
Most properties are sold via auction, indicating strong competition in the market.
Property sales breakdown
Compare recent sales across property types and bedroom configurations to understand differences in pricing and market activity.
| Bedrooms | 12 mo salesLast 12 months sales | Median price | Avg DOMAvg days on market | Clearance | RentRental median |
|---|---|---|---|---|---|
| AllAll houses | 326 | $2,208,000 | 29 days | 66% | $913 pw |
| 1 bed1 bedroom | 2 | — | — | 1% | — |
| 2 bed2 bedrooms | 10 | $1,475,000 | 23 days | 71% | — |
| 3 bed3 bedrooms | 83 | $1,950,000 | 26 days | 67% | $750 pw |
| 4 bed4 bedrooms | 135 | $2,180,000 | 26 days | 73% | $1,030 pw |
| 5 bed5 bedrooms | 74 | $2,883,000 | 36 days | 51% | $1,250 pw |
Across the 198 recent sales shown, houses accounted for the largest share at about 80% of results. Townhouses make up the next largest group in the mix. Four-bedroom layouts were the most common bedroom count among the sales with bedroom data. Auction sales were the most frequent sale method, at about 50% of recorded results. Disclosed prices in this window ranged from $245,000 to $7,300,000. House results sat above unit outcomes in this sample, with house medians around $2,115,000 compared with $828,000 for units.
Sales by price range
House sales grouped by price band over the past 12 months.
Most sales in the past 12 months sit in the $2m–$3m band (150 sales). Data as at September 2026.
Recent sold properties
Browse recently sold properties to compare sale prices, property features and recent market evidence.
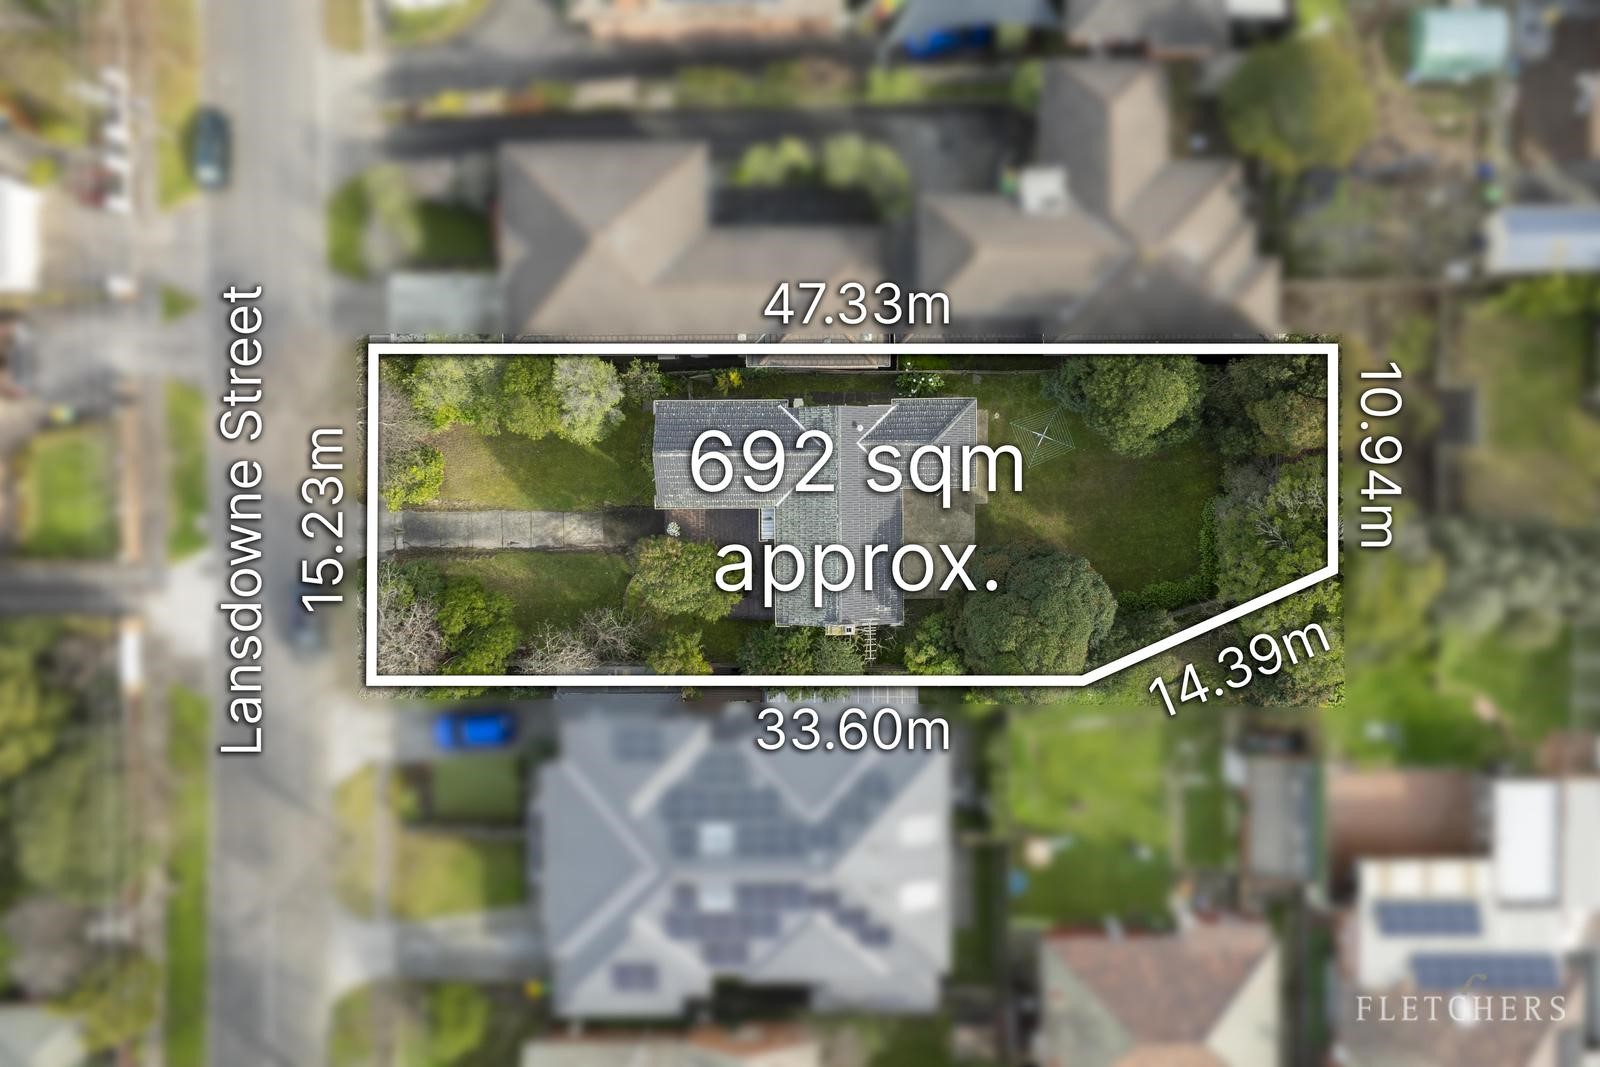
65 Lansdown Street
Balwyn North
211$1,620,000
Sold 20 Sept 2026
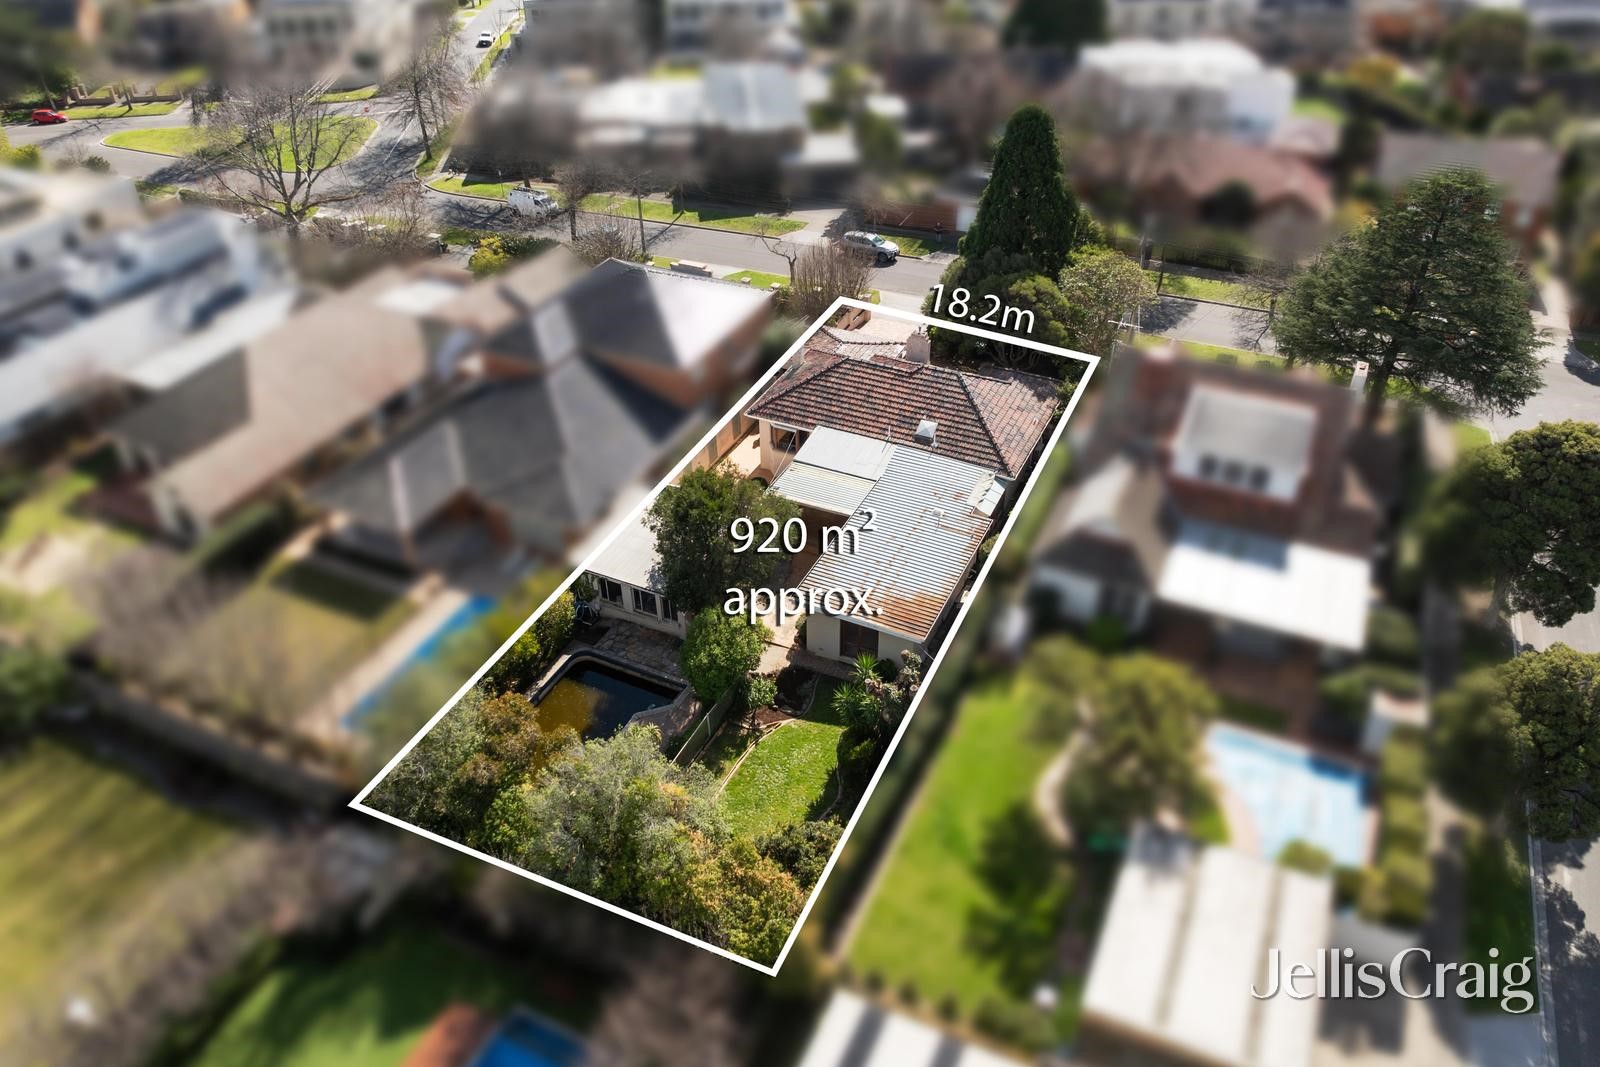
14 Tormey Street
Balwyn North
324Price withheld
Sold 19 Sept 2026
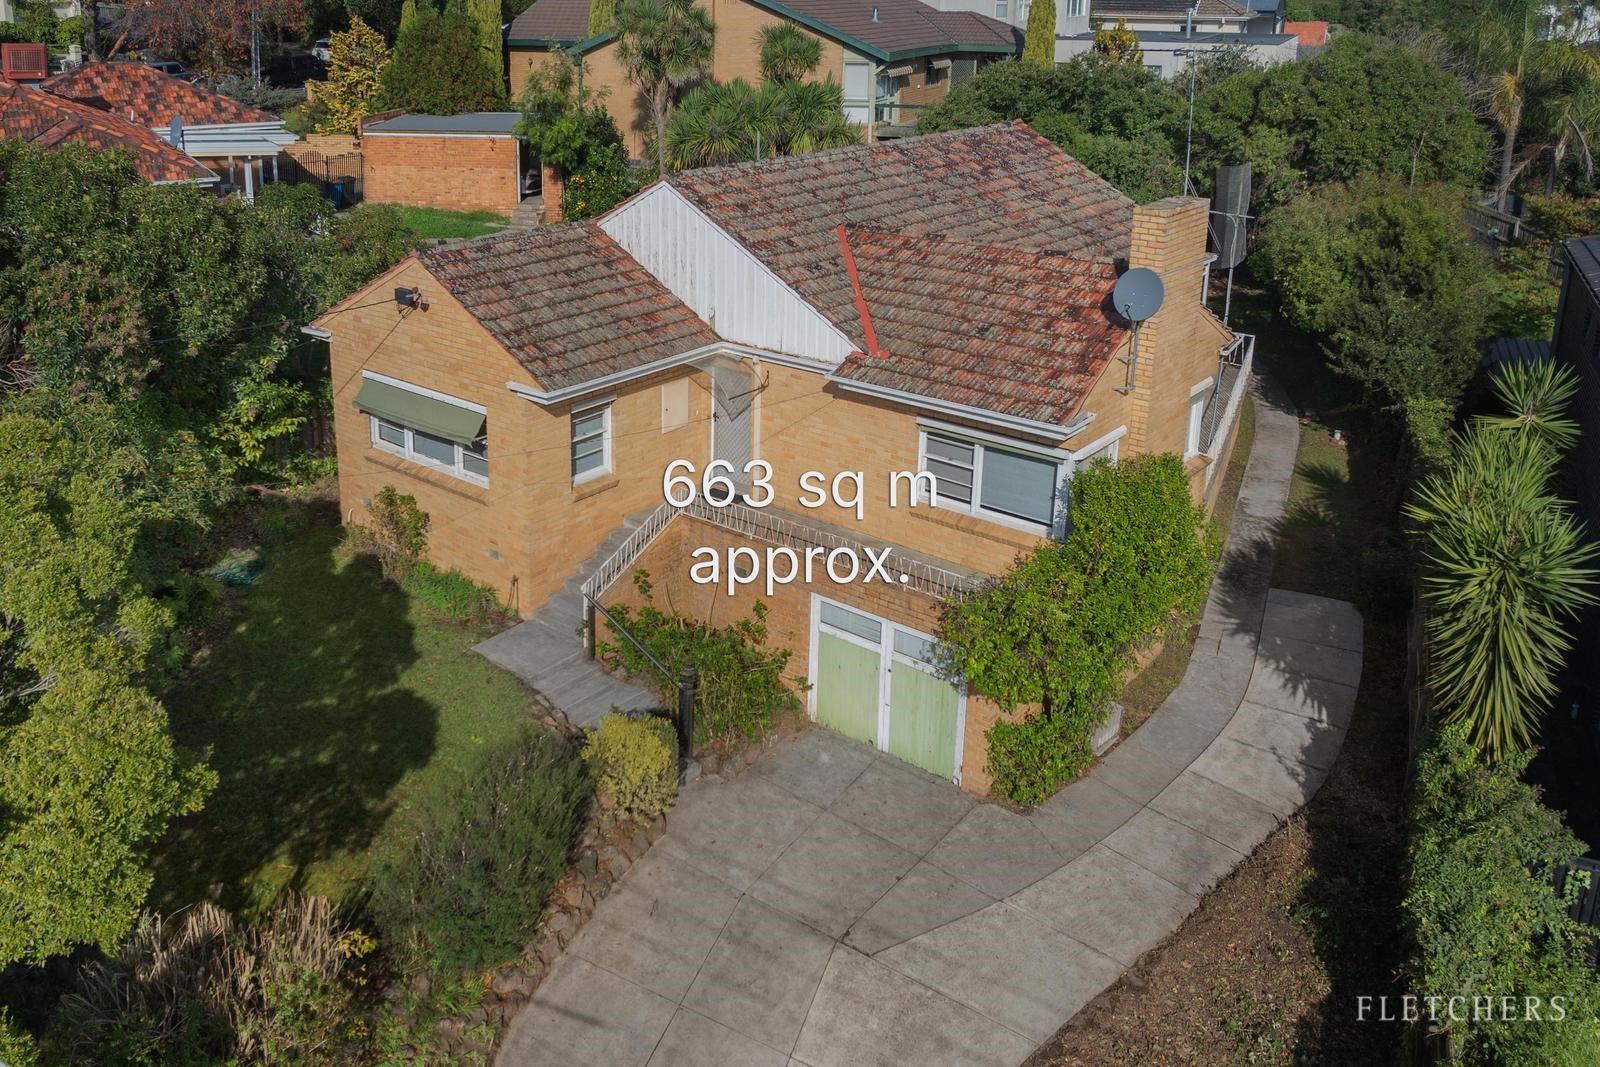
10 Hillview Road
Balwyn North
311$1,370,000
Sold 19 Sept 2026
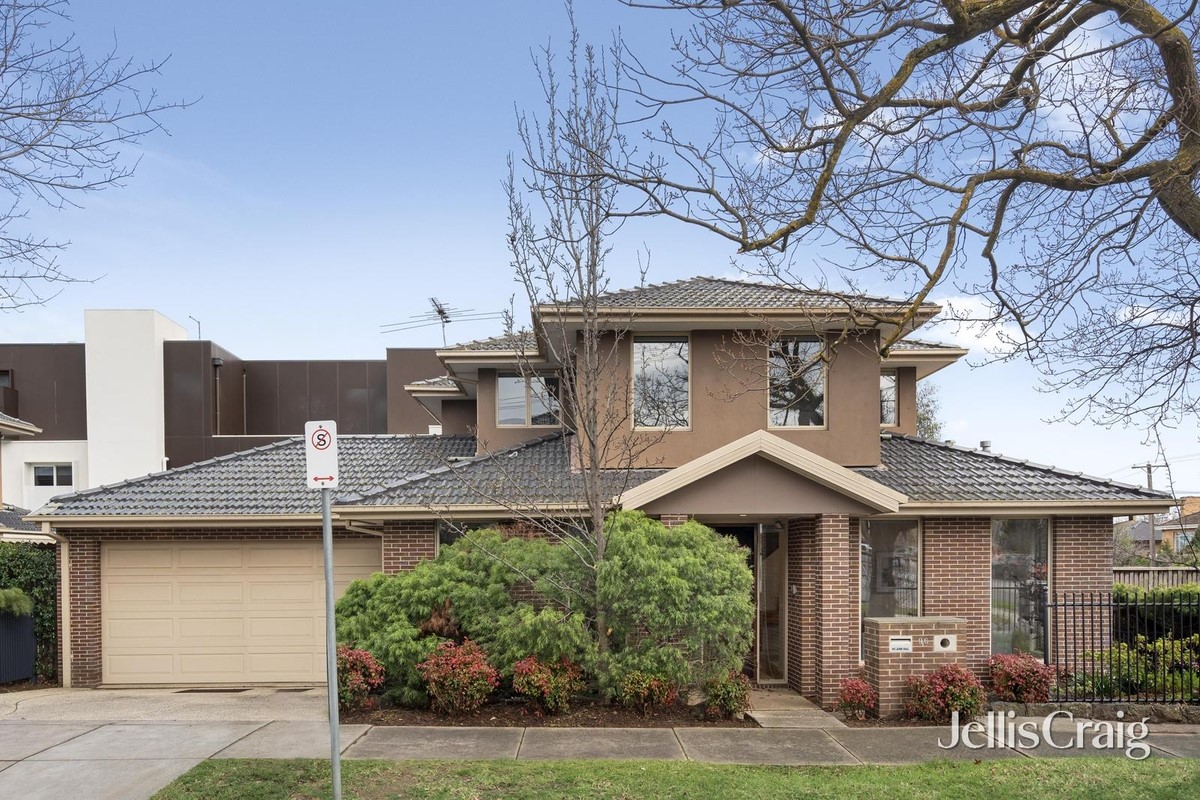
96 Doncaster Road
Balwyn North
322$1,507,500
Sold 19 Sept 2026


A more considered view on your property's value